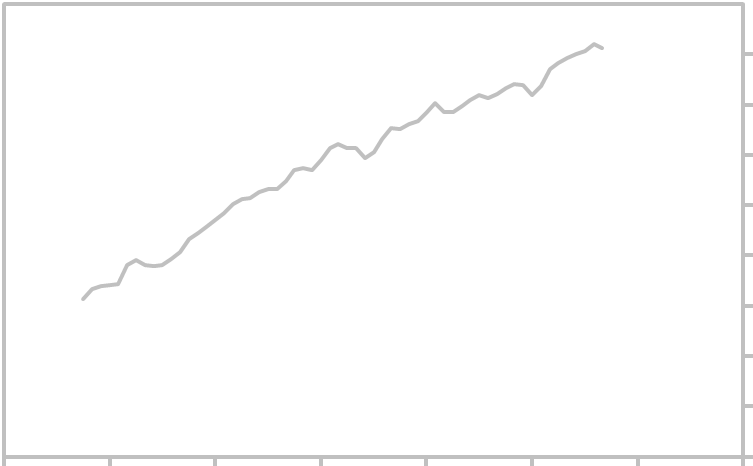
Monthly US National Retail and Food Services Sales index is plotted in gray. The forecast for the
target month is shown in green. Other links related to this economic indicator are below.
US National Retail and Food Services Sales Index - 5 Year History
|
US Retail, Food Services Sales Index Forecast
|
|
|
|
|
|
|
1992
1993
1994
1995
1996
1997
1998
1999
|
168
180
194
205
217
228
238
258
|
|
|
|
2000
2001
2002
2003
2004
2005
2006
2007
|
274
282
289
301
319
359
375
373
|
|
|
|
|
2008
2009
2010
2011
2012
2013
2014
2015
|
366
345
366
391
407
422
439
444
|
|
|
|
|
|
Average monthly US Retail Sales are shown in this table: 1992 to present
|
|
|
|
|
|
|
Source: U.S. Bureau of the Census, Retail and Food Services Sales [RSAFS], retrieved from FRED,
Federal Reserve Bank of St. Louis; https://fred.stlouisfed.org/series/RSAFS
1/14
1/2016
1/2020
US Retail and Food Services Sales Forecast
|
|
| |
|
Target Month:
Forecast:
HDTFA:
|
|
September, 2020
544.9
20.05
|
|
| |
Forecast for US National Retail and Food Services Sales Growth for the target
month indicated. Measurement is in Billions of Dollars (seasonally adjusted).
|
|
|