Commentary 11453
3rd Quarter, 2012 Data: Michigan
The 12 month forecast for Michigan Real Estate prices is in the table at the top
of this page. Forecast-Chart.com is forecasting a rise in Michigan Home Prices
of 0.66%. The table shows a HDTFA of 2.62% which suggests that appreciation
rates over the next year for Michigan Real Estate could easily end up anywhere
between 3.28% and -1.96%. Links to Forecasts for 49 other states and the
District of Columbia may be found on the right side of this page.
The average real estate forecast for all 50 states is 0.17%. So Michigan Real
Estate prices are forecasted to perform similar to the rest of the country. The
highest appreciation rate forecast of all Real estate forecasts at this site is
5.65% for Arizona. The lowest is -4.46% for Georgia.
Historical Home Price Appreciation: Michigan
Last Quarter 1.97%
Last Year -0.1%
Last 5 Years -20%
Last 10 Years -17%
Last 20 Years 49%
Decline From All Time High 25.74%
Annual Home Price Appreciation Rates: Michigan
1982 -16.02%
1983 7.52%
1984 2.45%
1985 6.58%
1986 10.28%
1987 10.17%
1988 6.58%
1989 6.55%
1990 3.97%
1991 4.63%
1992 3.03%
1993 2.91%
1994 6.19%
1995 7.40%
1996 8.05%
1997 7.23%
1998 5.75%
1999 7.22%
2000 7.07%
2001 5.10%
2002 3.98%
2003 3.91%
2004 3.95%
2005 2.14%
2006 -2.10%
2007 -5.49%
2008 -8.40%
2009 -7.54%
2010 -1.66%
2011 -2.58%
The highest annual appreciation rate in Michigan Real Estate was 22% in the
twelve months ended with the 1st Quarter of 1979. The worst annual
appreciation rate in Michigan was -16% in the twelve months ended with the 4th
Quarter of 1982.
The highest appreciation in Michigan Real Estate over a three year period was
55% in the three years ended with the 3rd Quarter of 1979. The worst
appreciation over a three year period in Michigan was -21% in the three years
ended with the 1st Quarter of 2010.
This page provides a five year chart of appreciation rates and a forecast for the
Michigan House Price Index. The chart shows the five years ended in the 3rd
Quarter of 2012. For links to longer term charts, look at the links under the five
year chart (above). One link opens a chart showing over thirty years of
historical appreciation rates for Michigan Real Estate. Another opens a graph
showing over thirty years of the Michigan House Price Index. Just one glance at
our long term charts can provide tremendous insight into the historical trends of
residential property values. And those pages contain more than just charts.
You'll find a wealth of other helpful statistics about Michigan Real Estate.
Historical data on the Michigan House Price Index is available back to the first
quarter of 1975. All calculations are based on the quarterly value of the House
Price Index for Michigan.
In this site, you may view the one, five & ten year home appreciation rates for
Michigan and the other 49 states in one convenient table. Click the 50 State
Home Appreciation Rate Table link above. The link is under the Michigan Real
Estate Appreciation Rate Chart at the top of this page. You'll see a snapshot of
historical Home Prices for Michigan as compared to U.S. home appreciation
rates.
_____________________________________________________________
Report a Problem with this Page Contact Us Privacy Policy Terms of Use/Disclosure
SignalTrend Inc. 2008 - 2012, All Rights Reserved
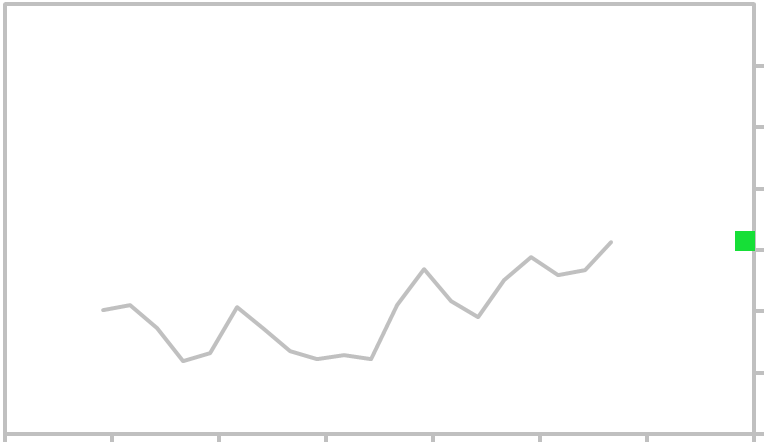
Average annual Michigan house appreciation RATE according to the House Price Index (HPI) is
shown in gray. The forecast for annual appreciation through the target month is shown in green.
shown in gray. The forecast for annual appreciation through the target month is shown in green.
| Michigan - Real Estate Appreciation Rate - 5 Year History |
| |||||||||||||||||||||||
| Michigan Real Estate Forecast |

| -10% |
| -5% |
| 0% |
| 5% |
| 10% |
| 15% |
| Real Estate Forecast: 15 Michigan Cities Home Values Appreciation Rate - US Cities 50 State Home Appreciation Rate Table |
Forecast & Real Estate Commentary
| -15% |
1/07 1/2008 1/2009 1/2010 1/2011 1/2012 1/2013 1/14
| Forecasts, charts and analysis... |
|
|

