| . |


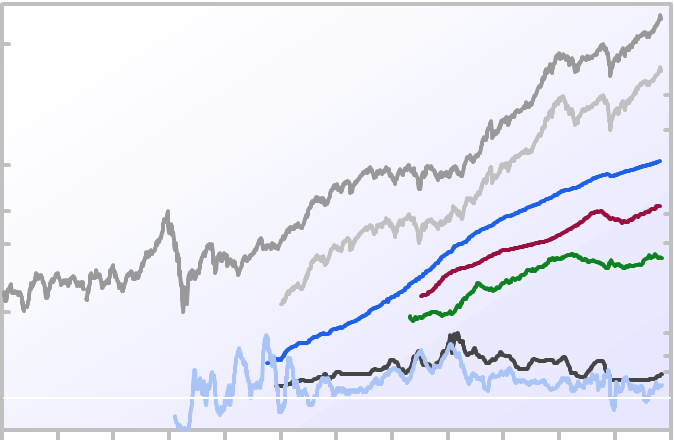
| 100 Year Chart |
| 0% |
| 21% |
| -11% |
| Inflation |
| U.S. Dollar |
| DJIA |
| S&P 500 |
| 89% Decline |
Stock Market Closed for 4.5
Months because of WWI
Months because of WWI
/
| Watergate & Arab Oil Embargo '73 |
/
9/11/01
/
| Pearl Harbor '41 |
\
| Black Tuesday 10/29/1929 |
/
| 22% Crash on10/19/87 |
| Korean War '50 -'53 |
| Cuban Missile Crisis '62 |
\
| Kennedy Assassination '63 |
\
| Savings & Loan Bailout '88 |
| Iraq Invaded Kuwait '90 |
-
| 1020 |
| 187 |
| 380 |
13930
| 43 |
| 735 |
| 64 |
| 118 |
| 1550 |
\
| Home Prices |
| GNP |
| Prime Rate |
| Latin American Debt Crisis (early 80's) |
| 2008 Bank Bailout |
/
| Banks Closed (1933) |
-
| USSR Exploded it's first Atomic Bomb '49 |
\
| Suez Canal Crisis 1956 |
\
| Berlin Wall Built '61 |
\
| Vietnam War 1965-1973 |
/
| Nixon Resigned |
\
| Iraqi War 2003 |
| 1907 Bankers' Panic |
| \ |
| Great Depression '29 - '43 |
| Roaring 20's |
| \ |
| Hitler Invades Czecho- slovakia 1939 |
| / |
| Federal Reserve formed 1913 |
| 10% |
| 5% |
Source of Inflation, GNP and Interest Rate data: Federal Reserve Bank of St. Louis.
GNP, Home Prices, the U.S. Dollar and the monthly close for the DJIA and the S&P 500 are
shown in logarithmic scale. The annual rate for prime rate and inflation are shown monthly in
a modified, semi logarithmic scale.
GNP, Home Prices, the U.S. Dollar and the monthly close for the DJIA and the S&P 500 are
shown in logarithmic scale. The annual rate for prime rate and inflation are shown monthly in
a modified, semi logarithmic scale.
GNP: US Gross National Product.
Prime Rate: U.S. Bank Prime Loan Rate.
DJIA: Dow Jones Industrial Average (monthly close).
S&P 500: Standard & Poor's 500 (monthly close).
Home Prices: US House Price Index - Purchase Only Index, by the Federal Housing Financing Agency.
Inflation: Points above the white line indicate inflation. Points below the white line indicate deflation.
US Dollar: Trade weighted index of the value of the US Dollar by the Economic Research division of the
Federal Reserve Bank of St. Louis.
Updated May 10, 2018
| ______________________________________________________________________________ Search Report a Problem with this Page Site Map Contact us Privacy Policy Terms of Use/Disclosure SignalTrend Inc. 2008 - 2015, All Rights Reserved |
2000
2010
1990
1980
1970
1930
1960
1950
'20
1920
1940
1910
'00