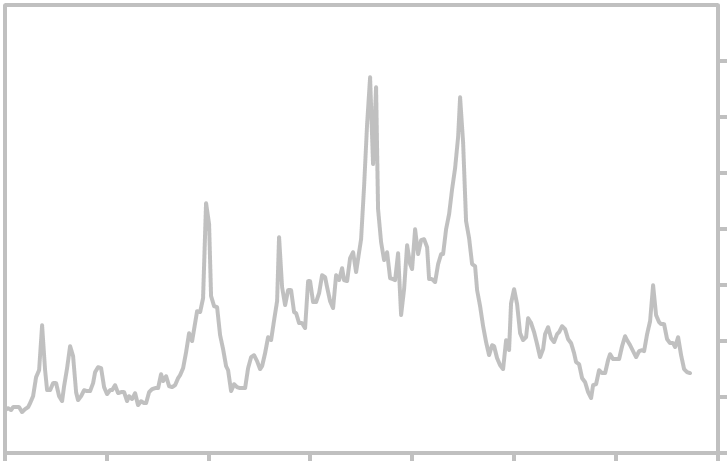
Natural Gas Price Index: Henry Hub, LA - 14 Year Graph
|
The above graph shows the monthly Natural Gas Market Price: Henry Hub, LA. Measurement is in
Dollars Per Million BTU. Source: Dow Jones & Company. For the forecast and other links related to
this economic indicator, click the links below. Updated Thursday, May 31, 2018.
Natural Gas Market - Annual Percentage Change
|
|
|
|
|
|
|
|
|
|
1994
1995
1996
1997
1998
1999
2000
|
-19%
60%
41%
-39%
-26%
36%
279%
|
|
|
|
|
2001
2002
2003
2004
2005
2006
2007
|
-73%96%
29%
8%
97%
-48%
5%
|
|
|
|
|
2008
2009
2010
2011
2012
2013
2014
|
-19%
-8%
-20%
-25%
6%
27%
-18%
|
|
|
|
|
|
The annual percentage change in the price of Natural Gas is shown in this table: 1994 to
present. The average December Natural Gas Price is compared to the average December
Natural Gas Price for previous year to calculate the annual percentage gain or loss.
|
|
|
|
|
|
1990
2000

