| . |


| 80% |
| 85% |
| 60% |
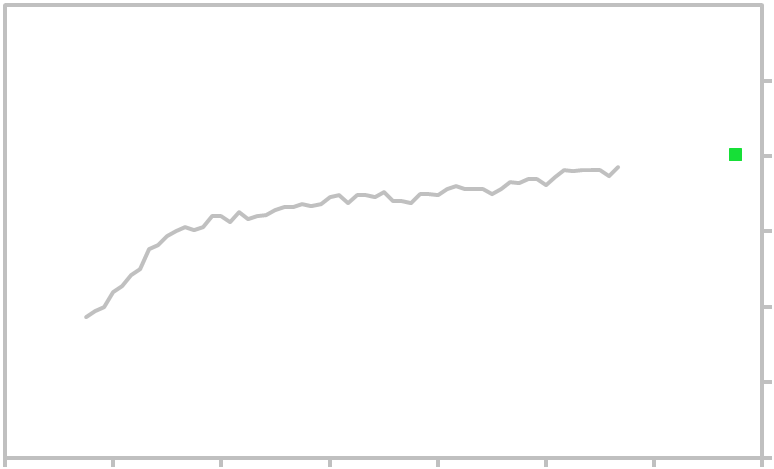
Monthly Capacity Utilization Rates (Total US Industry) is plotted in gray. The forecast for the target
month is shown in green. Other links related to this economic indicator are below.
month is shown in green. Other links related to this economic indicator are below.
| Capacity Utilization Rates (Total US Industry) - 5 Year History |
| 75% |
| 70% |
| 65% |
Capacity Utilization Rate Forecast
| 10 Year Chart - Industry Capacity Utilization Rates 41 Year Graph - US Capacity Utilization (Industrial) |
______________________________________________________________________________ Search Report a Problem with this Page Site Map Contact us Privacy Policy Terms of Use/Disclosure SignalTrend Inc. 2008 - 2015, All Rights Reserved |
| ||||||||||||||||||||||||||||||||||||||||||||||||||||||||||||||||||||||
| |||||||||||||||||||||||||
1/14
| 1/2015 |
1/2016
| 1/2017 |
| 1/2018 |
| 1/2019 |
1/2020
| 1/21 |
Source: Board of Governors of the Federal Reserve System (US)
| ||||||||||||||||