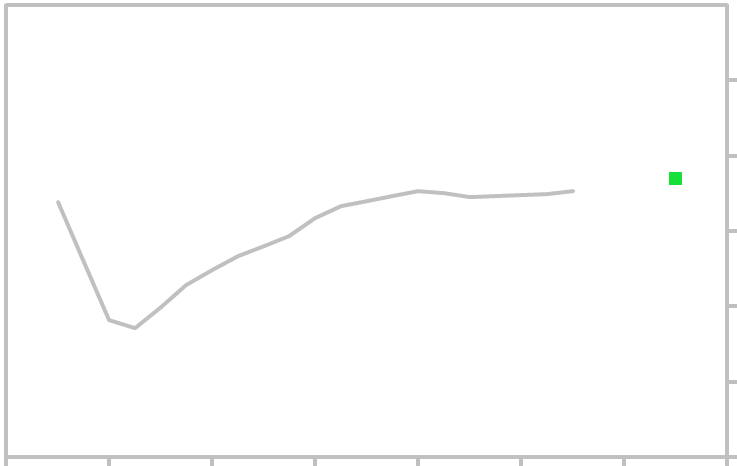
Quarterly United States Imports of Goods & Services (Total) is plotted in gray. The forecast for the
target quarter is shown in green. Other links related to this economic indicator are below.
US Imports of Goods & Services (Total) - 5 Year History
|
United States Imports Forecast
|
|
|
|
|
|
|
1947
1948
1949
1950
1951
1952
1953
1954
1955
1956
1957
1958
1959
1960
1961
1962
1963
1964
1965
1966
|
8
10
9
12
15
15
16
15
17
19
20
20
22
23
23
25
26
28
32
37
|
|
|
|
1967
1968
1969
1970
1971
1972
1973
1974
1975
1976
1977
1978
1979
1980
1981
1982
1983
1984
1985
1986
|
40
47
51
56
62
74
91
127
123
151
182
212
253
294
318
303
329
405
417
453
|
|
|
|
|
1987
1988
1989
1990
1991
1992
1993
1994
1995
1996
1997
1998
1999
2000
2001
2002
2003
2004
2005
2006
|
509
554
592
630
624
669
721
814
904
965
1057
1116
1252
1476
1400
1430
1540
1798
2025
2238
|
|
|
|
|
2007
2008
2009
2010
2011
2012
2013
2014
2015
2016
2017
2018
|
2370
2529
1956
2357
2664
2740
2770
2875
2782
2736
2916
3199
|
|
|
|
|
|
United States Imports are shown in this table: 1947 to present
|
|
|
|
|
|
Source: U.S. Bureau of Economic Analysis, Imports of Goods and Services [IMPGS],
retrieved from FRED, Federal Reserve Bank of St. Louis;
https://fred.stlouisfed.org/series/IMPGS
United States Imports Forecast
|
|
| |
|
Target Month:
Forecast:
HDTFA:
|
|
2nd Quarter, 2020
$3,214
$256
|
|
| |
Forecast for US Imports of Goods & Services (Total) for the target
quarter indicated. Measurement is in Billions of Dollars (seasonally
adjusted annual rate).
|
|
|
1/15
1/2018

